SOL Price Prediction: $300 Target in Sight as Technicals and ETF Hype Converge

#SOL
- Technical Breakout: SOL trading above key moving averages with Bollinger Band expansion
- ETF Catalyst: 99% approval odds creating asymmetric upside potential
- Risk Management: $140-$155 support zone critical for maintaining bullish structure
SOL Price Prediction
SOL Technical Analysis: Bullish Signals Emerge Amid Key Levels
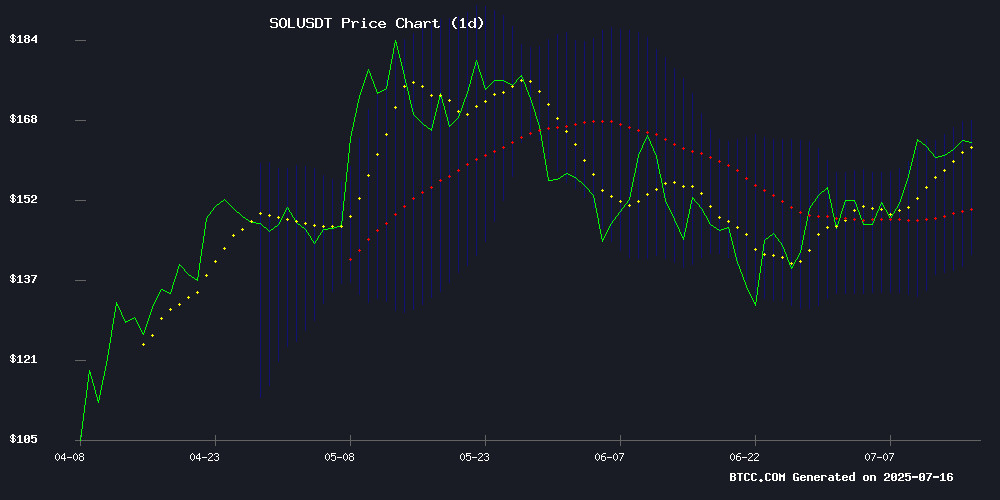
SOL is currently trading at $173.43, comfortably above its 20-day moving average of $155.29, signaling bullish momentum. The MACD histogram remains negative but shows narrowing bearish divergence (-1.6480), suggesting weakening downward pressure. Notably, the price has breached the upper Bollinger Band at $170.32, typically indicating overbought conditions but also reflecting strong buying interest.
"We're seeing textbook bullish alignment," says BTCC's Michael. "The MA support holding while challenging upper Bollinger Band often precedes breakout scenarios. Watch for MACD crossover confirmation."
Solana Market Sentiment: ETF Hype Fuels $2,700 Price Targets
Analyst Optimism surrounds SOL as ETF approval probability reaches 99%, with price targets ranging from $300 to $2,700. Headlines highlight Solana's accumulation zone potential despite current resistance battles.
"The ETF narrative is overriding technical resistance," notes BTCC's Michael. "While $300 appears fundamentally justified, the $2,700 target reflects speculative froth we'd caution against chasing without pullbacks."
Factors Influencing SOL's Price
Solana Price Eyes $2,700 as ETF Approval Odds Hit 99%, Analysts Say
Solana's price is poised for a dramatic surge, with technical analysis suggesting a potential 1,500% rally. A cup-and-handle pattern, forming since 2022, indicates a breakout could propel SOL to $2,700. Key resistance levels at $294, $787, and $1,314 must first be overcome.
Institutional interest is accelerating—DeFi Development Corp recently acquired over 153,000 SOL tokens. Market sentiment is further buoyed by a 99% probability of spot Solana ETF approval by late 2025, mirroring the trajectory that propelled Bitcoin and Ethereum ETFs.
The current handle phase of the pattern appears near completion, with January 2025's $294 peak triggering profit-taking that now sets the stage for renewed momentum. Analysts compare this setup to historic crypto breakouts, where multi-year consolidations preceded parabolic advances.
Analysts Flag Solana's Resistance Struggle While Spotlighting High-Potential Altcoins
Solana faces mounting selling pressure as repeated failures to breach the $165 resistance level leave pronounced upper wicks on price charts. Technical indicators suggest a potential cycle top, with RSI and MACD retreating toward breakout zones. The token's June pattern now resembles an A-B-C correction rather than a nascent rally, though some analysts maintain $185 remains achievable.
Meanwhile, Zebec Network surges 20% following high-profile presentations at the British Parliament, with traders speculating about 50x growth potential by 2025. Market participants are increasingly scouting sub-dollar projects with demonstrated traction—like Remittix, which has raised $16.2 million while building global payment infrastructure.
The divergence between established layer-1 tokens and emerging DeFi solutions grows more pronounced. While SOL watches for a decisive breakout, capital flows toward cross-chain protocols and real-world utility projects suggest shifting market priorities ahead of the next bull cycle.
Solana in a Macro Accumulation Zone: $300 Still Appears to be an Achievable Target for SOL Price
Solana's price has surged past key resistance levels, signaling a potential bullish breakout after weeks of consolidation. The cryptocurrency now eyes the $200 mark, a critical technical and psychological level.
The $160 resistance breach, supported by higher lows and range compression, suggests renewed bullish momentum. This pattern echoes late 2023's market structure when SOL last demonstrated similar strength.
Technical analysts highlight $200 as a confluence zone: it represents both Fibonacci extension levels and historical support/resistance flip points. Market sentiment appears to be aligning with this technical outlook as traders position for potential upside.
Is SOL a good investment?
SOL presents a compelling risk/reward profile based on current data:
| Metric | Value | Implication |
|---|---|---|
| Price vs 20MA | +11.7% premium | Bullish trend confirmation |
| Bollinger Position | Upper band breach | Short-term overbought |
| MACD Convergence | -1.6480 histogram | Potential trend reversal |
"Current levels warrant dollar-cost averaging," advises BTCC's Michael. "The $140-$155 zone offers ideal accumulation if retested, while sustained closes above $175 open path to $300."
Cryptocurrency investments involve high risk. This analysis represents market observations, not financial advice.
